An article from Sean Lawless and John Olita of group-stats.com. You can also follow their work on Twitter @groupstats
Editor’s Note from Brian: I realize that not everyone has the resources to track all advanced basketball analytics, but anyone who keeps team rebounding stats can calculate rebounding percentage which is more meaningful than rebounding margin. You might not be able to track individual offensive or defensive rebounding percentages for the whole team, but if there is a player or two that you would want to have that individual feedback for, you could do it for them with a little extra data collection.
Dennis Rodman, Reggie Evans, and an Analytic Look at Rebounding
Rebounding (this will be the first and last time I refer to rebounding as a whole, from this point on it will be defensive rebounding and offensive rebounding) is an area of the game that makes a strong but simple case for the use of analytics for a couple of reasons. First, when looking at statistics like rebounds per game and rebound margin it is very easy to see the flaws that these stats present. Second, unlike some of basketball’s advanced stats, it is very easy to look at offensive and defensive rebounding analytically.
First, let’s get into the issues with the traditional stats mentioned above. The statistic rebounds per game (team or individual) runs into many problems. First and foremost, defensive and offensive rebounding are two different skills. The two skills are accomplished at much different rates. It is easier to pull down defensive rebounds than it is to grab offensive rebounds. So, naturally, the team whose defense forces the most missed shots will have the greatest amount of defensive rebounding opportunities. Thus the defense is being rewarded with lots of rebounds for forcing missed shots, right? Wrong.
The first issue arises with the following question: What if the defense forces a lot of turnovers? They will get very few defensive rebounding opportunities. Second, a team’s defensive rebounding should never be praised or criticized because of other areas of defense (like forcing or not forcing turnovers). Defensive rebounding is a skill that stands alone and statistics should represent that. The opposite applies for the offensive end as well. If your team turns the ball over a lot, the opponent will have less defensive rebounding opportunities. Now, thinking about everything you just read, consider how this might apply to rebound margin. Rebound margin is a stat that is talked about it locker rooms throughout basketball. As noted above one team, during a game, might have more defensive rebounding opportunities than the opponent. The team with more defensive rebounding chances will likely have a positive rebounding margin. Because the number of turnovers and missed shots is always varying, we should not use rebounding margin to determine a team’s rebounding ability.
Now what is the solution to the issues presented with traditional rebounding statistics? It’s pretty simple Offensive Rebounding Percentage (OR%) and Defensive Rebounding Percentage (DR%). These stats simply represent the percentage of offensive/defensive rebounds a team gets out of the amount of offensive/defensive opportunities the team has.
OR%=Offensive Rebounds/(Offensive Rebounds + Opponent Defensive Rebounds)
DR%=Defensive Rebounds/(Defensive Rebounds + Opponent Offensive Rebounds)
By isolating the rebounding, the stats give a true depiction of how good the team is at offensive and defensive rebounding. Applying this to individuals looks like this.
Individual OR%= Individual Offensive Rebounds/(Own Team Offensive Rebounds while individual is on the court + Opponent Defensive Rebounds while individual is on the court)
Individual DR%= Individual Defensive Rebounds/(Own Team Defensive Rebounds while individual is on the court + Opponent Offensive Rebounds while individual is on the court)
The formulas above show the percentage of offensive/defensive rebounds an individual gets divided by the amount of offensive/defensive rebounding opportunities there are while he’s on the court.
Defensive rebounding is best graded by the amount of defensive rebounds you get out of the amount defensive rebounding opportunities there are.
Offensive rebounding is best graded by the amount of offensive rebounds you get out of the amount of offensive rebounding opportunities there are.
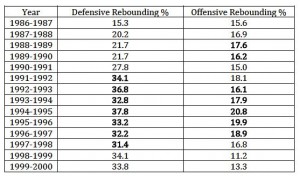
On the individual level, Dennis Rodman is looked at by most as the greatest rebounder of all time, regardless of what rebounding statistics you believe in. Examining his rebounding statistics is almost as entertaining as it was to watch him pull down those boards during his prime. Here is a look at his career rebounding percentages.
The numbers above are nothing short of incredible. Take a look at 1994-1995, his best year rebounding the ball. Rodman rebounded 37.8% of his opponents missed shots and 20.8% of his team’s missed shots. Both led the league (bold numbers are years in which Rodman led the NBA in the stat).
Understanding how impressive Rodman’s numbers allow one to truly appreciate Reggie Evan’s 2012-2013 season. Evan’s led the NBA in DR% and OR%. His OR% was a solid 15.5, but what really stands out is his DR% of 38.0. The number was higher than any mark Rodman ever put up. Reggie Evans is on the basketball court for one reason. To rebound the ball, and his 2012-2013 season was as good as you are going to see. His 37.8% mark is now the single season record for DR%.


