Stephen Halstead, Assoc Head Men’s Basketball Coach, Grace College
This video is a segment from one of the 120 Videos in Glazier Drive Basketball.
Explore coaching clinic replays, practice plans, skill development videos, and more. Click here to see all that’s included.
The full video that this clip came from is available on Glazier Drive: End-of-Game Situations & Clock Management.
LATE-GAME FOULING STRATEGY: DATA-DRIVEN INSIGHTS FOR COACHES
This video breaks down research on a critical late-game decision: when you’re up three, should you foul or defend a potential tying three-pointer? Here’s what the data shows for men’s college basketball.
THE CORE QUESTION
When a trailing team is down three and attempting a tying three, should the leading team foul intentionally or play normal defense? The answer depends heavily on how much time is left on the clock.
WHAT THE DATA TRACKS
The study segments game situations into four time windows — 0–4, 4–8, 8–12, and 12–16 seconds remaining — and measures three outcomes: overtime rate, regulation comeback wins, and overall win percentage for the leading team.
KEY FINDINGS BY TIME WINDOW
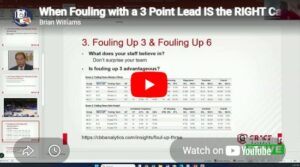
- 12–16 seconds, no foul: The trailing team forced overtime 16.7% of the time and actually won in regulation 25% of the time. That’s a significant risk for the leading team.
- 8–12 seconds, no foul: Overtime rate drops to 9%.
- 4–8 seconds, no foul: Overtime rate drops further to 7%.
- 0–4 seconds, no foul: Three-point shooting drops to 17%, overtime rate is 16.9%, but regulation comeback wins are rare. The leading team wins about 92% of the time.
THE FOULING ADVANTAGE
When the leading team intentionally fouls a non-shooter (not a three-point shooter) in a non-threatening position — such as near half court — the win rate jumps to approximately 95% compared to 92% when defending normally. That 3% difference can be decisive over a season.
IMPORTANT CONTEXT: COLLEGE VS. NBA
This data is specific to men’s college basketball. In the NBA, the numbers actually favor defending normally rather than fouling. Coaches must apply the right data set to their level of play.
COACHING TAKEAWAY
The presenter’s staff commits to fouling before the opposing team crosses half court with under 8 seconds remaining. The key principles are:
- Never foul a three-point shooter
- Foul in a non-threatening position (near half court)
- Decide your threshold as a staff — 8 seconds, 10 seconds, etc. — and make sure your players know it
Having a clear, practiced rule eliminates hesitation in crunch-time moments and gives your team the best statistical chance of closing out the game.