• Skip to primary navigation
  • Skip to main content
  • Skip to primary sidebar

  • Basketball Plays
    • Ball Screen Sets
    • Horns Sets
    • Man to Man Post Up
    • Man to Man Isolations
    • Backdoor Plays
    • Man to Man 3 Point Shot Plays
    • 2-3 Zone Attack
    • Baseline Inbound Plays
    • Sideline Inbound Plays
    • Combination Defense Attack
  • Drills
    • Defensive Drills
    • Offensive Drills
    • Competitive Drills
    • Passing Drills
    • Rebounding Drills
    • Shooting and Scoring Drills
    • Toughness Drills
    • Transition & Conversion Drills
    • One on One Drills
  • Blueprint
  • Practice
  • Mental Toughness
  • Skill Development
  • Offense
  • Defense
  • Store

Analytics

An Analytical Look at Rebounding

By Brian Williams on April 7, 2016

An article from Sean Lawless and John Olita of group-stats.com. You can also follow their work on Twitter @groupstats

Editor’s Note from Brian: I realize that not everyone has the resources to track all advanced basketball analytics, but anyone who keeps team rebounding stats can calculate rebounding percentage which is more meaningful than rebounding margin. You might not be able to track individual offensive or defensive rebounding percentages for the whole team, but if there is a player or two that you would want to have that individual feedback for, you could do it for them with a little extra data collection.

Dennis Rodman, Reggie Evans, and an Analytic Look at Rebounding

Rebounding (this will be the first and last time I refer to rebounding as a whole, from this point on it will be defensive rebounding and offensive rebounding) is an area of the game that makes a strong but simple case for the use of analytics for a couple of reasons. First, when looking at statistics like rebounds per game and rebound margin it is very easy to see the flaws that these stats present. Second, unlike some of basketball’s advanced stats, it is very easy to look at offensive and defensive rebounding analytically.

First, let’s get into the issues with the traditional stats mentioned above. The statistic rebounds per game (team or individual) runs into many problems. First and foremost, defensive and offensive rebounding are two different skills. The two skills are accomplished at much different rates. It is easier to pull down defensive rebounds than it is to grab offensive rebounds. So, naturally, the team whose defense forces the most missed shots will have the greatest amount of defensive rebounding opportunities. Thus the defense is being rewarded with lots of rebounds for forcing missed shots, right? Wrong.

The first issue arises with the following question: What if the defense forces a lot of turnovers? They will get very few defensive rebounding opportunities. Second, a team’s defensive rebounding should never be praised or criticized because of other areas of defense (like forcing or not forcing turnovers). Defensive rebounding is a skill that stands alone and statistics should represent that. The opposite applies for the offensive end as well. If your team turns the ball over a lot, the opponent will have less defensive rebounding opportunities. Now, thinking about everything you just read, consider how this might apply to rebound margin. Rebound margin is a stat that is talked about it locker rooms throughout basketball. As noted above one team, during a game, might have more defensive rebounding opportunities than the opponent. The team with more defensive rebounding chances will likely have a positive rebounding margin. Because the number of turnovers and missed shots is always varying, we should not use rebounding margin to determine a team’s rebounding ability.

Now what is the solution to the issues presented with traditional rebounding statistics? It’s pretty simple Offensive Rebounding Percentage (OR%) and Defensive Rebounding Percentage (DR%). These stats simply represent the percentage of offensive/defensive rebounds a team gets out of the amount of offensive/defensive opportunities the team has.

OR%=Offensive Rebounds/(Offensive Rebounds + Opponent Defensive Rebounds)

DR%=Defensive Rebounds/(Defensive Rebounds + Opponent Offensive Rebounds)

By isolating the rebounding, the stats give a true depiction of how good the team is at offensive and defensive rebounding. Applying this to individuals looks like this.

Individual OR%= Individual Offensive Rebounds/(Own Team Offensive Rebounds while individual is on the court + Opponent Defensive Rebounds while individual is on the court)

Individual DR%= Individual Defensive Rebounds/(Own Team Defensive Rebounds while individual is on the court + Opponent Offensive Rebounds while individual is on the court)

The formulas above show the percentage of offensive/defensive rebounds an individual gets divided by the amount of offensive/defensive rebounding opportunities there are while he’s on the court.

Defensive rebounding is best graded by the amount of defensive rebounds you get out of the amount defensive rebounding opportunities there are.

Offensive rebounding is best graded by the amount of offensive rebounds you get out of the amount of offensive rebounding opportunities there are.

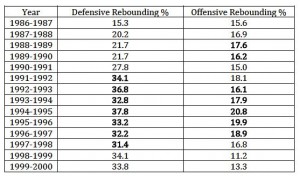
On the individual level, Dennis Rodman is looked at by most as the greatest rebounder of all time, regardless of what rebounding statistics you believe in. Examining his rebounding statistics is almost as entertaining as it was to watch him pull down those boards during his prime. Here is a look at his career rebounding percentages.

reboundingpercent

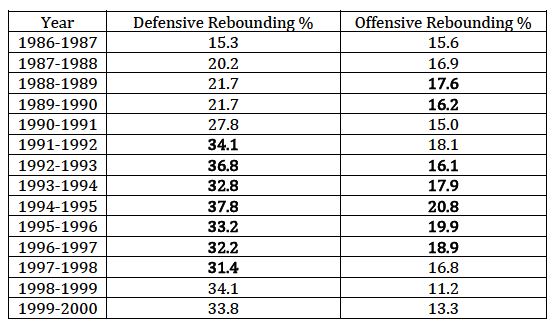
The numbers above are nothing short of incredible. Take a look at 1994-1995, his best year rebounding the ball. Rodman rebounded 37.8% of his opponents missed shots and 20.8% of his team’s missed shots. Both led the league (bold numbers are years in which Rodman led the NBA in the stat).

Understanding how impressive Rodman’s numbers allow one to truly appreciate Reggie Evan’s 2012-2013 season. Evan’s led the NBA in DR% and OR%. His OR% was a solid 15.5, but what really stands out is his DR% of 38.0. The number was higher than any mark Rodman ever put up. Reggie Evans is on the basketball court for one reason. To rebound the ball, and his 2012-2013 season was as good as you are going to see. His 37.8% mark is now the single season record for DR%.

Refocus Your Focus: Real Stats

By Brian Williams on January 21, 2016

This post was written by Bert DeSalvo and reprinted with permission from his Basketball Coaching Blog, Expressions from the Hardwood

Editor’s Note from Brian Williams, the Coaching Toolbox. I like the emphasis this article puts on determining what types of traditional stats and analytics that your team could benefit from and focusing on those. I also believe in measuring the process of going to the offensive glass and block outs as a part of evaluating your rebounding.

My third takeaway from this article is that you have to use context when evaluating your stats. I had a friend who played for a very successful coach. After one game, he got on his team hard because they had been outrebounded by their opponent by three rebounds. Their team had gone 6 for 15 from the free throw line, which was way below their season free throw percentage. He realized that had they made 4 more free throws that their opponents rebounded, they would have won the rebound battle by one. As coaches, we have to be careful and think clearly

Refocus Your Focus: Real Stats

Bert DeSalvo, @CoachDeSalvo

I recently read a great article by Gabe Kapler, former MLB player and Minor League Manager, on how current MLBers need to reexamine how they are looking at their individual performance. This reevaluation has to do primarily with looking at statistics differently.

In the article Kapler suggests that “Players simply need to stay in ‘baseball school,’ pay attention, keep an open mind and evolve with the decision makers.” Quite profound.

As a basketball coach, I started thinking is our profession thinking outside the box regarding statistics?

As basketball coaches (aka ‘decision makers’) and teachers, we tend to have that favorite stat that we always are interested in and focus on. For some it is field goal percentage, for others it is 3pt field goals attempted. Others have a defensive charts that tally deflections, shot clock violations, etc. The possibilities are endless and probably depend on our personal basketball journey (prior coaches, favorite teams/coaches, clinics, etc.).

For instance, I have known coaches at halftime or the end of the game, who go right to the rebound margin to see how the team was rebounding in a particular game.

The problem for me was that this statistic was most often very skewed. The reason why I believe this was because sometimes this category was very sporadic from game-to-game.

Were we really this good, average or bad on a game-to-game basis? Possibly. Was the team were were playing either this good, average or bad on a game-to-game basis? What about the eye test? Makes you wonder if there is a better way to evaluate such a common statistic such as rebounding.

Well surely the opponent and their personnel matters. However, these up and down statistics were usually a direct result of something else I thought.

I found that some factors that gave the stats a slanted may have been: the opposing team was not pursuing the ball on the defensive or offensive end very well, the ball bouncing was our way (or not), we were simply taller or short than our opponent, there were lots of turnovers which limited shot attempts, or the fact that one team had one of the premier rebounders in the conference/nation who covered up many of his/her team’s rebounding deficiencies.

These factors among many others, are the reasons why I believe that the rebounding margin was not necessarily a true reflection of how well a team actually rebounded. I believe that rebounding margin has as much to do with other factors and not necessarily only rebounding technique, which is a better indicator of true rebounding prowess.

Whether you agree with my conclusion or not, as a Head Coach I never really focused on total rebounds (although that is important and locks up your defensive possession) but rather rebounding technique, i.e. defensive blockouts and offensive pursuit.

My definition of a ‘defensive blockout’ is making contact on each shot by the opposing team while I defined an ‘offensive pursuit’ as having our players taking at least three steps towards the offensive glass.

The result is much more process oriented rather than results oriented. As long as we were making contact or crashing the offensive glass, good things were bound to happen. That was much more of a better indication of our rebounding effort and general skill level than the rebounding margin.

Of course in the flow of the game it is very difficult to gauge defensive blockouts and offensive pursuits with limited staff. However, observant assistants and head coaches can surely get a gauge on the team’s overall effort level during the game (i.e. “Eye Test”) and use film after the game to get a more definitive number to present to the players.

Although getting these numbers are much more time consuming than merely getting a stat sheet from an SID, it will undoubtedly give coaches and players a more accurate glimpse into what is actually occurring on the court. This is important to be able to emphasize any aspect of the game and will reinforce the coaching staffs message. Remember film never lies.

Moreover, each player may get rated on a percentage during the course of a game or practice on how many times they actually execute what coaches are stressing in their program (i.e. in regards to rebounding technique Player A makes contact 70% of the time on defensive end). This is another great tool that can have a true impact on your program by showing your players how being accountable can have impact on teammates, how practices are conducted, morale of the team and ultimately the outcomes of games.

In addition, focusing on statistics for each team in the same category (i.e. rebounding technique), coaches may be able to get an even more analytic view of which team is more disciplined in certain areas of the game.

As Kapler reminds us, coaches too must be thinking of how to evaluate. For instance, if Coach A only sends three players to the offensive glass, while Coach B sends all five players, the number of course will be skewed in favor of Coach B’s squad. However, creative forethought can balance out these variables that coaches use based upon their program’s x and o philosophy.

Kapler continues, “imagine a husband taking out the trash everyday and feeling pretty good about handling his obligation. Meanwhile, his wife thinks, ‘I wish that lazy bum would wash the dishes once in a while!’ If expectations aren’t discussed regularly, they become mismatched. And we are in that place now in baseball.”

Likewise, basketball coaches must be sure to communicate with their players of how they will be evaluated so there is no ambiguity or questioning of what the coaching staff feels is important in their program. This will give the players a feeling of confidence that the know what is important, what will be stressed and how that will relate to playing time. It is the foundation to building accountability in any legitimate program.

Just as important, the coaching staff must come up with the appropriate innovative metrics of how to accurately evaluate their team so they are getting an accurate measure of whatever statistic they wish to emphasize.

About the Author

Bert DeSalvo formerly served as the Head Women’s Basketball Coach at Southern Connecticut State University (NCAA DII – NE-10 Conference). During his one season at the helm 2014-15 season, SCSU tallied more overall wins and had the 5th (out of 15) best record in the conference (picked last in preseason poll). The Owls also earned a first round bye in the post-season conference tournament.

Prior to leading the SCSU program, DeSalvo was owner of Full Court Consulting, a firm which served a variety college and high school coaches throughout the country. DeSalvo also is a regular contributor on multiple blogs including his own, Expressions from the Hardwood.

DeSalvo coached previously as the top assistant for the women’s basketball program at Division II Clarion University for two seasons. DeSalvo joined the staff in 2011-2012 after a four-year stint as the head coach and assistant director of athletics at Penn State-Beaver. DeSalvo started the PSU-Beaver program from scratch in January 2007 and led the Lions to a 99-26 (.792) record in his tenure at the school while qualifying for the United States Collegiate Athletic Association (USCAA) national tournament in all four seasons. DeSalvo led Penn State-Beaver the Lady Lions averaging 26 wins per season his last three campaigns. He was named the PSUAC Coach of the Year after the 2008 campaign and earned the Beaver County Hall of Fame Recognition Award as Women’s Basketball Coach of the Year in 2008, 2009 and 2010.

Prior to leading the Penn State-Beaver program, DeSalvo was an assistant women’s coach at Division III MacMurray College from August 2006 to January 2007. He also spent a season as a men’s assistant coach at NCAA Division I Maryland-Eastern Shore in 2005-2006 and was the girls’ varsity head coach at Chariho High School (RI) during the 2004-2005 season. He also has experience as a junior varsity, middle school and AAU coach.

DeSalvo has coached a number of professional players, All-Americans and All-Conference members during his career. DeSalvo has a career record of 113-41 (.734).

Player Performance Grading Scale

By Brian Williams on January 12, 2016

Submitted by Coach John Kimble
CoachJohnKimble.com

Retired high school and college coach

Follow him on Twitter @CoachJohnKimble

This post was originally written for Winning Hoops

Editor’s note from Brian Williams: I believe that whatever is recorded and rewarded will improve.

You might not have the resources to use all of these, but here is a very thorough player performance grading scale.

Hopefully, at the least, you can find a couple of items that you can track to emphasize the areas that you need to be good at to be successful

OFFENSIVE PERFORMANCE GRADE VALUES

TOTAL POINTS SCORED +1
INSIDE SHOTS MADE +2
INSIDE SHOTS MISSED -1
OUSIDE SHOTS MADE +2
OUTSIDE SHOTS MISSED -1
3 POINT SHOTS MADE +3
3 POINT SHOTS MISSED -1.5
FREE THROWS MADE +1
FREE THROWS MISSED -1
OFFENSIVE REBOUNDS (FG) +2
OFFENSIVE REBOUNDS (FT) +2
OFFENSIVE HUSTLE PLAYS +3
OFFENSIVE “LOAFS” -3
OFFENSIVE “BIG” PLAYS +3
GOOD SCREENS +1
INSIDE PASSES +1
ASSISTS +2
OFFENSIVE FOULS -2
BAD PASSES -2
BALL VIOLATIONS -2
FUMBLES -2
TIME VIOLATIONS -2
“OTHER’ VIOLATIONS -2
YOUR SHOT BLOCKED -1
OFFENSIVE MENTAL ERRORS -3
OFFENSIVE SMART PLAYS +3
BAD SHOTS TAKEN -1

PLAYER’S OFFENSIVE GRADE ***

DEFENSIVE PERFORMANCE GRADE VALUES

PRESSURE DEFENSE +2
DIVES FOR TEAM +2
DEFENSIVE HUSTLES +3
DEFENSIVE LOAFS -3
DEFENSIVE “BIG PLAYS” +3
DEFENSIVE REBOUNDS (FT) +2
DEFENSIVE REBOUNDS (FG) +2
GOOD BOXOUTS (FG) +1
“OVER THE BACK” BOX OUTS +3
STEALS/RECOVERIES/INTERCEPTIONS +3
FORCED TURNOVERS +2
PASS DEFLECTIONS +1
“WOLF” DEFLECTIONS +1
HELD BALL BY DEFENSE +1
BLOCKED SHOT +2
DRAW THE CHARGE +3
CHARGE/BLOCK FOUL +1
NO FT BOXOUT -3
NO FG BOXOUT -1
DEFENSIVE FOULS -1
OTHER DEFENSIVE VIOLATIONS -1
DEFENSIVE MENTAL ERRORS -3
DEFENSIVE SMART PLAYS +3

PLAYER’S DFENSIVE GRADE ***


OVERALL PERFORMANCE GRADE
TOTAL OFFENSIVE GRADE
TOTAL DEFENSIVE GRADE
TOTAL OVERALL GRADE
Offensive Grade/Minutes Played
Defensive Grade/Minutes Played
Total Overall Grade/Minutes Played

Offensive and Defensive “Leaders” wear “Leaders”
Practice Jerseys, have their name on the Leader
Boards both in the gym and locker room, have
stickers put on their locker and are the next
game’s captains.


About the Author

Coach Kimble was the Head Basketball Coaching position at Deland-Weldon (IL) High School for five years (91-43) that included 2 Regional Championships, 2 Regional Runner-Ups and 1 Sectional Tournament Runner-up. He then moved to Dunlap (IL) High School (90-45) with 2 Regional Runners-up, 1 Regional, 1 Sectional and 1 Super-Sectional Championship and a final 2nd Place Finish in the Illinois Class A State Tournament. He was an Assistant Basketball Coach at Central Florida Community College in Ocala, FL for 1 year before becoming Offensive Coordinator and then Associate Head Coach for 3 additional years He then was the Head Basketball Coach at Crestview (FL) High School for 10 years, averaging over 16 wins per season.

He has had articles published in the following publications such as: The Basketball Bulletin of the National Association of Basketball Coaches, the Scholastic Coach and Athletic Journal, Winning Hoops, Basketball Sense, and American Basketball Quarterly. He has also written and has had five books published along with over 25 different DVDs by Coaches Choice and Fever River Sports Production.

See him on Twitter @CoachJohnKimble and his Web Page “www.CoachJohnKimble.com”

Painfully Ill Advised Shots

By Brian Williams on December 29, 2015

This article was written by By Stephen Shea, Ph.D and published on his blog:  Basketball Analytics.  You can find out more about Dr. Shea and his work in the field of Basketball Anayltics at the end of this article.

Editor’s Note #1 from Brian Williams, The Coaching Toolbox: The acronym that Dr. Shea uses for Painfully ill-advised Shot Selection “PISS” is to make the point as to how he views those shots. You might want to find a new way to abbreviate this stat if you do want to use it with your players, and the intent is not to offend any coaches who are reading.

Editor’s Note #2 from Brian Williams, The Coaching Toolbox I realize that not everyone who reads this plays with a shot clock, but I do think that there are some very good points to think about–especially the point that by taking contested dribble pull up jump shots, you score at the same rate as a player that teams foul on purpose to force him to shoot free throws.

By Stephen Shea (@SteveShea33) and Christopher Baker (@ChrisBakerAM)

NBA possessions are a valuable and limited resource. Each shot is a gamble of that resource. The goal of an NBA offense is to try and create the best bets—shots with the highest expected winnings.

Of course, defenses have the opposite agenda. They are trying to force the worst bets.

Analytics have taught us that certain shots have better odds than others. For example, catch-and-shoot jumpers are better than pull-ups, players will shoot better when open than when contested, and mid-range FGA produce far fewer points per possession than shots from 3 or at the hoop.

The analytics are clear on which shots are the most desired, but offenses can’t always get what they want. As the shot clock counts down, the likelihood of finding a good shot dwindles. A mid-range catch-and-shoot jumper from a capable shooter or a contested 3 might become a reasonable wager.

Thus, we cannot always say that a contested 3 is bad simply because an open 3 would be better. We can’t simply suggest that every open mid-range jumper should have been an attempt at the rim. Determining the quality of a particular shot just isn’t that simple.

However, there is a class of shots that is so foolish that it can be universally condemned.

Pull-up and contested 2-pointers from at least 10 ft. from the hoop and with at least 5 seconds on the shot clock are the antithesis of analytics. Pull-up, contested, and mid-range are an efficiency-decreasing super team. These shots are particularly asinine when they are taken with enough time on the shot clock for a kickout.

To avoid repeating the phrase, “pull-up, contested, 2-pointers from at least 10 ft. from the hoop and with at least 5 seconds on the shot clock” and because we have an unhealthy interest in concocted titles for the sake of acronyms, let’s call these choices “painfully ill-advised shots” or PIS.

Last season, players generated 0.767 points per shot on PIS. (All stats are courtesy of NBA.com.) That’s the equivalent of a 25.6% 3-point shot or 2 free throws from 38.4% free throw shooter. DeAndre Jordan had a FT% of 39.7 and teams intentionally sent him to the line.

At first glance it may appear as though certain players are efficient PIS takers. Tony Parker shot 50.8% on 118 PIS in 2014-15. Beno Udrih shot 49.6% on PIS in 2014-15. However, neither of these players had previous seasons that suggested their efficiency is sustainable. Parker shot 43.1% and Udrih had a PIS% of 39.3 (albeit on a small sample set) in 2013-14.

With only two seasons of the appropriate data to calculate PIS, we can’t say for certain that no players can consistently be efficient enough to make PIS a reasonable choice for the offense. However, preliminary results suggest not.

Not every player gets the same opportunity to take PIS. PIS is best understood as a percentage of a player’s shot selection. Let PIS selection or PISS be the percentage of a player’s FGA with at least 5 seconds on the shot clock that were PIS.

Most good players don’t often choose to take PIS. James Harden had a PISS of 10%, Steph Curry had a PISS of 8.5%, LeBron James had a PISS of 8.2%, Manu Ginobili had a PISS of 5.4%, and Demarre Carroll had a PISS of 2.7%.

Of course, there are the other players, players that have never seen a bad shot, or players with a seemingly uncontrollable urge to PISS.

If it were a contest, DeMar DeRozan would be the PISS champ.

DeRozan had a PISS of 31.6%. Nearly a third of his 850 shots with at least 5 seconds on the shot clock were PIS.

DeRozan shot an atrocious 33.5% on PIS. That equates to 0.67 points per shot. In all of his 2014-15 FGA, DeRozan scored 0.85 points per shot. If he simply removed those 269 PIS (kicked out instead of forcing a bad shot), he would have raised his efficiency to 0.92 points per shot on the season.

DeRozan’s team would have appreciated the kick outs. His team produced 1.02 points per shot. If his team kept that efficiency on kick outs that replaced DeRozan’s 269 PIS, the team would have scored another 93 points in DeRozan’s 60 games.

DeRozan’s PISS of 31.6% in 2014-15 was up from 26.2% the previous season. As the influence of analytics in the NBA grows, we might expect players’ PISS to decrease. In time, it probably will. In fact, DeRozan might be one of the last of a dying breed. Players that depend on PIS as significant portions of their offense were the norm in the 80s and 90s. In 5-10 years, they will likely be extinct.

However, suggesting that analytics are only pushing PISS down would be ignoring half the game. Analytically savvy teams are studying their opponents’ offensive weaknesses. They are recognizing when players like DeRozan will too easily take a PIS. Then, they are forcing that player to take a PIS. If you don’t believe me, listen to Shane Battier talk specifically about his defensive strategy to force Kobe to take a PIS. Click here to listen to Shane Battier on how analytics made him better (three and a half minutes).

In an interview, Battier revealed, “after studying and going through the school of analytics, I knew exactly to a tee who Kobe Bryant was. And I knew as a defender trying to stop him, Kobe’s worst-case scenario and my best-case scenario was to make him shoot a pull up jumper going to his left hand…”

So, DeRozan’s increase in PISS might be a result of both him not realizing the inefficiency of PIS and opposing defenses exploiting his lack of that understanding.

DeRozan is the PISS champ, but he’s not the only player taking too high of a percentage of these shots.

PISS appears to be more an intrinsic quality of the individual than a product of a team’s offensive system. Jarrett Jack, Shaun Livingston and Mo Williams have all changed teams over the last two seasons and seen their PISS follow them.

This doesn’t mean that teams can’t employ strategies to decrease PISS. Of course, teams can try to avoid acquiring players with a high PISS. Beyond that, teams can stress the importance of avoiding these shots.

Teams can support players by providing alternatives to a PIS. For example, the team can regularly station quality shooters on the perimeter and in the corners. This provides good options for a kick out on penetration. Good shooters on the perimeter will also keep help defenders out of the lane and increase the likelihood that the penetrating player will have a path all the way to the hoop.

Houston, Philadelphia and Atlanta had the lowest team PISS in 2014-15. That’s not surprising given that these teams are all recognized as being analytically savvy. Philadelphia’s position shows that teams do not need a tremendous amount of talent to have a low PISS. It’s an organizational decision based on an awareness of analytics.

For teams, the applications of this analysis are direct.

  1. Teams should be reluctant to acquire players with high PISS. This is especially true when that individual is weak in other areas (such as defense).
  2. Teams should look to make defensive adjustments that force players to take a PIS. This would mean running a player like Kobe Bryant off of the 3-point line while having the help defense under the hoop that will persuade Bryant to pull up in mid-range.
  3. Finally, teams should implement offensive systems that reduce PISS. This means stressing the team’s disinterest in this shot, but also playing the personnel and designing plays that regularly provide better opportunities.

NBA possessions are a valuable and limited resource. Players taking contested, mid-range, pull-up 2-pointers with at least 5 seconds on the shot clock are pissing it away.

About the Author, Stephen Shea

Stephen Shea is an associate professor of mathematics at Saint Anselm College in Manchester, NH. He earned a Ph.D. in mathematics from Wesleyan University in Middletown, CT, and a B.A. in mathematics from The College of the Holy Cross in Worcester, MA. His mathematical expertise and publication record is in the areas of probability, statistics, dynamical systems, and combinatorics. For years, he has been applying his abilities in these areas to study professional and amateur sports. Stephen is a managing partner of Advanced Metrics, LLC, a consulting company that provides analytics solutions to basketball and hockey organizations. At Saint Anselm College, he runs a course on sports analytics. His sport writing has been featured in the Journal of Quantitative Analysis in Sports, Psych Journal, the Expert Series at WinthropIntelligence.com, and the Stat Geek Idol Competition for TeamRankings.com. In 2013, Stephen coauthored the book, Basketball Analytics: Objective and Efficient Strategies for Understanding How Teams Win, and co-created the accompanying blog BasketballAnalyticsBook.com. In 2014, he authored Basketball Analytics: Spatial Tracking.

An In-Depth Analysis of Old and New Statistics

By Brian Williams on September 15, 2015

Submitted by Coach John Kimble
CoachJohnKimble.com

Retired high school and college coach

See him on Twitter @CoachJohnKimble

This article was originally written for Winning Hoops

An In-Depth Analysis of Old and New Statistics

Let’s suppose the following partial list of statistics are taken from the last game that your basketball team played. Team A won the game 68 – 49. What factors contributed to Team A’s win, but what other stats could be conceived somewhat of a negative to Team A—stats that tell you some phases of the game need to be corrected? What stats tell you that and what phases need to be worked on? Let’s analyze the stats and come up with some conclusions from the eyes of coaching staffs of both teams.

My first overall observance would be the “Points per Possession” (PPP) of both teams. This vital statistic evaluates the overall offensive and defensive performance of both teams. Team A scored on an average .681 points on every possession (which totaled 72). That calls for closer scrutiny of Team A’s offensive statistics. Offensively, I would look first for reasons for a low “PPP.” Most likely, the reasons are either because of poor shooting percentage(s) in field goals and/or free throws. I would not only look also at the number of turnovers but the “Turnover Frequency.” This statistic compares overall offensive turnovers with the total possessions an offensive team has in the entire game. Total Turnovers is a stat that can be misleading in that it doesn’t take into account the style and tempo that the offensive team employs. An offensive team that pushes the ball quickly in an up-tempo style of play will have more possessions in a game. The more possessions in a game, the more likely that more points will be scored as well as more turnovers may be committed. “Turnover Frequency” measures teams’ ballhandling skills and abilities on a level playing ground, regardless of whether that offensive team plays an up-tempo style or more of a slow-down tempo style.

Team A out-shot Team B in overall field goal percentage convincingly, so that should be a concern for Team B and therefore studied more closely. Team B’s poor field goal shooting percentage could be attributed to the numbers of types of shots taken and the “Component Frequencies.” 43.8 % of all shots for Team B were “Inside Shots” (shots that were taken inside the free throw lane) and that specific shooting percentage was not extremely high (41.7 %) Team B’s “3-Point Shot Component Frequency” was almost the most frequently taken shot and that actual shooting percentage was the lowest of all three types of shots (31.8 %). The “Outside Shot Component Frequency” was 35.8 % while the accuracy was only 36.8%. (Outside Shots are defined as any shots outside of the free throw lane but inside the three point line.) The overall analysis for Team B would be to work on all three types of shooting in practice and also maybe discuss better shot selection. Compared to losing team’s “Shot Analysis,” the winning team shot the ball much better “in the paint” as well as “behind the arc.” The winning team’s worst type of shot was also the shot that was used the least (22. % of all shots were “Outside Shots”) In my opinion, Team A won the game because of better shot selection and better overall shooting accuracy. Team A played to their shooting strength(s) and tried to avoid their shooting weakness (the mid-range shot). As far as turnovers, the discrepancy between “A’s” 10 turnovers and “B’s” 12 turnovers could at least be attributed to a possible more up-beat tempo (by studying and comparing both teams’ overall possessions for the game—68 and 72 possessions respectively. Team A’s “TO Frequency of .147 compared to Team B’s .166 is not a drastic advantage for Team A, but still an advantage for Team A. Team A should have had (slightly) fewer turnovers than Team B because of (slightly) fewer team possessions so neither team really gained an advantage because of “Turnover Frequency.”

The “Free Throw” phase of the game for Team B suffered greatly and also made a difference in the outcome of the game. Team B’s 33.3% was terrible and by missing the front end of the two “1 & 1’s”, they not only lost those 2 points but also the chance for two other free throws. Team A’s 68.2 % FT Percentage compared to Team B’s 33.3 % not only was more than twice as good, but allowed Team A to outscore Team B from the FT line 15 points to 4. If Team B doesn’t address the poor Free Throw shooting problem and instead complains about the “12 to 22 FT Attempt” discrepancy, they should examine the number of “FT Trips” for each team—not the number of Free Throws taken by each team. Again, when a team misses the front end of a “1 & 1,” they are surrendering the opportunity to shoot a second free throw. 10 to 7 in “Free Throw Trips” is not a huge discrepancy for Team B to complain about. This statistic may also indicate that Team A is more aggressive offensively by attacking the defense via of the dribble or by going inside more than Team B. This is proven by the discrepancy that Team A enjoys in overall “Inside Passes” (27-15) and overall “Inside Shots” (21-12). This may also indicate that Team B is a poorer “on the ball” and/or “post defensive team” than Team A is. The small discrepancy in the number of free throw trips could also have taken place with Team A having a lead late in the game that forced Team B to foul late in the game.

A team loses possession of the ball by missed shots and turnovers while it can gain possession of the ball by “defensive rebounds,” “defensive forced turnovers,” or after “made” baskets. Therefore, these factors should be measured. “Defensive Forced Turnovers” is a defensive stat that tells how many times a defensive team has forced the opposition into a turnover. It is somewhat subjective because each opponent’s turnover must be evaluated as to whether the offense made a mistake or the defensive team caused the offensive team to make a mistake. “Defensive Forced Turnover Frequency” equally measures how much pressure each defensive team places on the opponent compared with total possessions during that game. This combination prevents the skewing of the “Forced Turnover” statistic. In this case, Team A had 8 “Defensive Forced Turnovers” compared to Team B’s 4 “Defensive Forced Turnovers.” But because of the number of possessions that both teams had (Team A had 68 and Team B had 72), the actual frequencies indicate that Team A did not quite maintain the “2 to 1” advantage it had over Team B. Team A had 72 opportunities to obtain the 8 actual “Defensive Forced Turnovers” it created versus the 68 opportunities that Team B had to grab the actual 4 defensive turnovers. Team B may want to also work offensively on taking care of the ball while also working on more of a defensive pressure effort.

Under the same line of thinking, as important as certain stats are; the frequency of that particular statistic is more revealing than the base statistic. Another two examples are defensive and offensive rebounding in correlation to the number of opportunities each team has for those rebounds. “Defensive Rebounding Frequencies” and “Offensive Rebounding Frequencies” give a coaching staff a truer picture and a better measuring tool to evaluate this important phase of the game. In this game, Team A had an advantage in “Defensive Rebounds” because Team B had more missed field goals and free throws that have a chance to be (defensively) rebounded. Team A had 39 chances to obtain its 27 defensive rebounds. Team B had 29 chances to obtain the 21 defensive rebounds it obtained. Team B’s “Defensive Rebound Frequency” is actually higher at 72.4 % than Team A’s frequency. The “Offensive Rebound Frequency” statistic gives a coaching staff a much more reliable evaluation tool than the “Offensive Rebound” statistic (for the same reasons as the “Defensive Rebound Frequency” statistic).

table1

table2

INDIVIDUAL STATISTICS

Total Minutes Played
Offensive Margin per Minute
Defensive Margin per Minute
Contribution Margin per Minute
Offensive Margin per Full Game
Defensive Margin per Full Game
Contribution Margin per Full Game

Sometimes a player does not appear to have obvious or outstanding contributions for his performance by using the standard game stats, but it just seems that every time that player is in the game; good things happen for his team. Trying to make this somewhat subjective evaluation an objective evaluation can be done by simply keeping track of when players enter and/or exit the games by monitoring the score and the actual time on the clock.  For instance, Duane Wade of Team A could come in the second quarter of the game with 6:12 on the clock and with Team A leading 20 to 19. When he went to the bench with 3:42 in the same quarter, his team was then leading 29 to 21. This small amount of data gives the player an example of his three various “margins per minute” now discussed.

His “Offensive Margin per Minute” for just this part of the game would be the nine points his team scored in the 2 ½ minutes of his specific playing time. This means that Duane’s team averaged 3.6 points per minute (9 pts divided by 2.5 minutes) in this specific part of the game.

In that same time span, Team A gave up only 2 points in the same 2 ½ minutes of this game. This makes the “Defensive Margin per Minute” for Duane a rating of .8 points allowed per minute played (2 divided by 2.5 minutes).

When Duane started his 2 ½ minute segment of the game, his team was ahead by just one point. When he came out of the game, his team was now ahead of the game by a total of eight points. This increase in the lead was a total of seven points over the course of this specific 2 ½ minutes. This equates to a + 2.8 points per minute (7 points divided by 2.5 minutes) of this segment of the game.

This is then calculated for the overall contribution per minute played. This number is then multiplied by 32 (32 minutes per game) to give a hypothetical number that would state what Duane’s team would have done if Duane would have played every second of this particular game.   Every segment of every player would have these three “margins per minute” accumulated to have three final statistics that can help tell how every player had contributed as a team member. Hypothetically on paper, Team A would have scored 115.2 points in the game, while allowing only 25.6 points to win by a huge margin of 89.6 points. Regardless of what the old fashioned statistics say of Duane’s performance, he was a part of that overall team contribution. As detailed as stats can be, some things cannot be measured on players’ individual performances.   These unique stats can help a coaching staff evaluate individual and overall team performances.

Taking the time to keep these unique statistics and then spending time and energy in evaluating them can not only give a coaching staff a clearer measuring stick for each player’s individual and overall team performance for each game. This might help players understand their value and their actual playing time which could help improve team chemistry and therefore the overall team’s performance. These statistics are worth the effort.

About the Author

Coach Kimble was the Head Basketball Coaching position at Deland-Weldon (IL) High School for five years (91-43) that included 2 Regional Championships, 2 Regional Runner-Ups and 1 Sectional Tournament Runner-up. He then moved to Dunlap (IL) High School (90-45) with 2 Regional Runners-up, 1 Regional, 1 Sectional and 1 Super-Sectional Championship and a final 2nd Place Finish in the Illinois Class A State Tournament. He was an Assistant Basketball Coach at Central Florida Community College in Ocala, FL for 1 year before becoming Offensive Coordinator and then Associate Head Coach for 3 additional years He then was the Head Basketball Coach at Crestview (FL) High School for 10 years, averaging over 16 wins per season.

He has had articles published in the following publications such as: The Basketball Bulletin of the National Association of Basketball Coaches, the Scholastic Coach and Athletic Journal, Winning Hoops, Basketball Sense, and American Basketball Quarterly. He has also written and has had five books published along with over 25 different DVDs by Coaches Choice and Fever River Sports Production.

See him on Twitter @CoachJohnKimble and his Web Page “www.CoachJohnKimble.com”

  • « Go to Previous Page
  • Page 1
  • Page 2

Primary Sidebar

  • Twitter
  • Facebook
  • Linkedin
coachestoolbox
personaldevelopmenttoolbox
basketballplayerstoolbox
basketballtrainer
athleticperformancetoolbox
coachingbasketball

© Copyright 2026 Coaching Toolbox

Privacy Policy